Basic Display System in Apache Zeppelin
Text
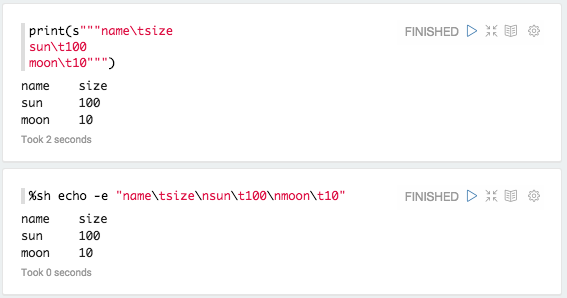
By default, Apache Zeppelin prints interpreter response as a plain text using text display system.
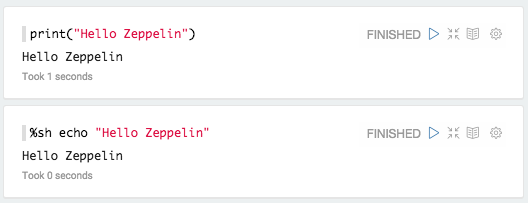
You can explicitly say you're using text display system.
Html
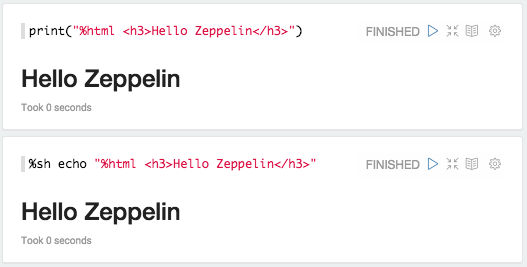
With %html directive, Zeppelin treats your output as HTML
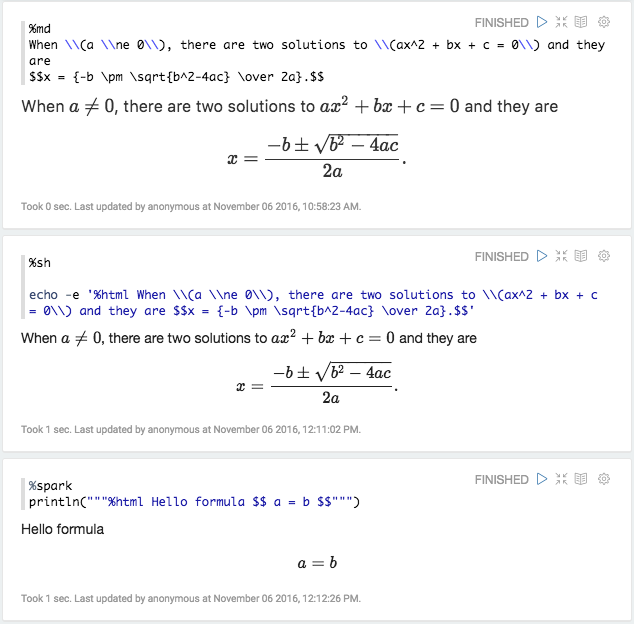
Mathematical expressions
HTML display system automatically formats mathematical expression using MathJax. You can use
\\( INLINE EXPRESSION \\) and $$ EXPRESSION $$ to format. For example
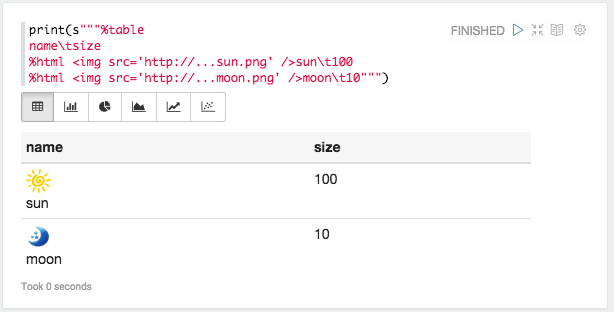
Table
If you have data that row separated by \n (newline) and column separated by \t (tab) with first row as header row, for example
You can simply use %table display system to leverage Zeppelin's built in visualization.
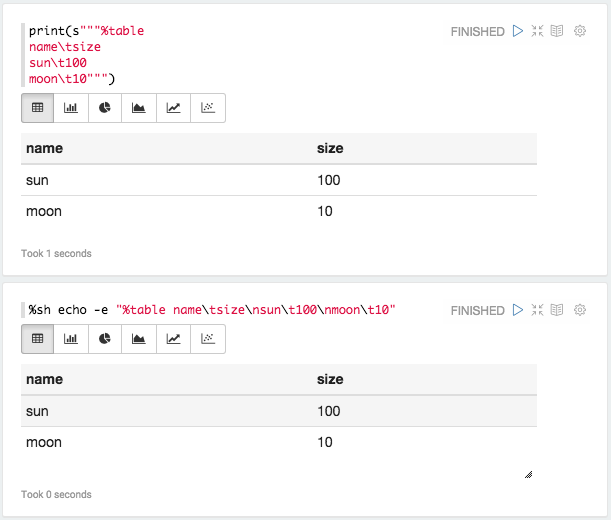
If table contents start with %html, it is interpreted as an HTML.
Note : Display system is backend independent.
Network
With the %network directive, Zeppelin treats your output as a graph. Zeppelin can leverage the Property Graph Model.
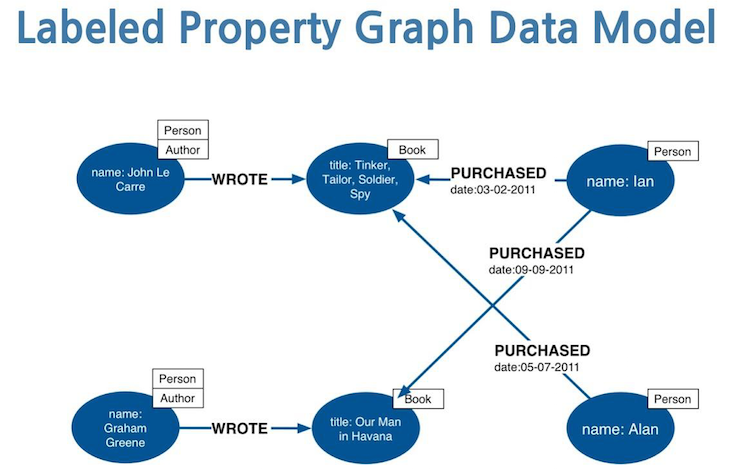
What is the Labelled Property Graph Model?
A Property Graph is a graph that has these elements:
- a set of vertices
- each vertex has a unique identifier.
- each vertex has a set of outgoing edges.
- each vertex has a set of incoming edges.
- each vertex has a collection of properties defined by a map from key to value
- a set of edges
- each edge has a unique identifier.
- each edge has an outgoing tail vertex.
- each edge has an incoming head vertex.
- each edge has a label that denotes the type of relationship between its two vertices.
- each edge has a collection of properties defined by a map from key to value.

A Labelled Property Graph is a Property Graph where the nodes can be tagged with labels representing their different roles in the graph model
What are the APIs?
The new NETWORK visualization is based on json with the following params:
- "nodes" (mandatory): list of nodes of the graph every node can have the following params:
- "id" (mandatory): the id of the node (must be unique);
- "label": the main Label of the node;
- "labels": the list of the labels of the node;
- "data": the data attached to the node;
- "edges": list of the edges of the graph;
- "id" (mandatory): the id of the edge (must be unique);
- "source" (mandatory): the id of source node of the edge;
- "target" (mandatory): the id of target node of the edge;
- "label": the main type of the edge;
- "data": the data attached to the edge;
- "labels": a map (K, V) where K is the node label and V is the color of the node;
- "directed": (true/false, default false) wich tells if is directed graph or not;
- "types": a distinct list of the edge types of the graph
If you click on a node or edge on the bottom of the paragraph you find a list of entity properties
This kind of graph can be easily flatten in order to support other visualization formats provided by Zeppelin.
How to use it?
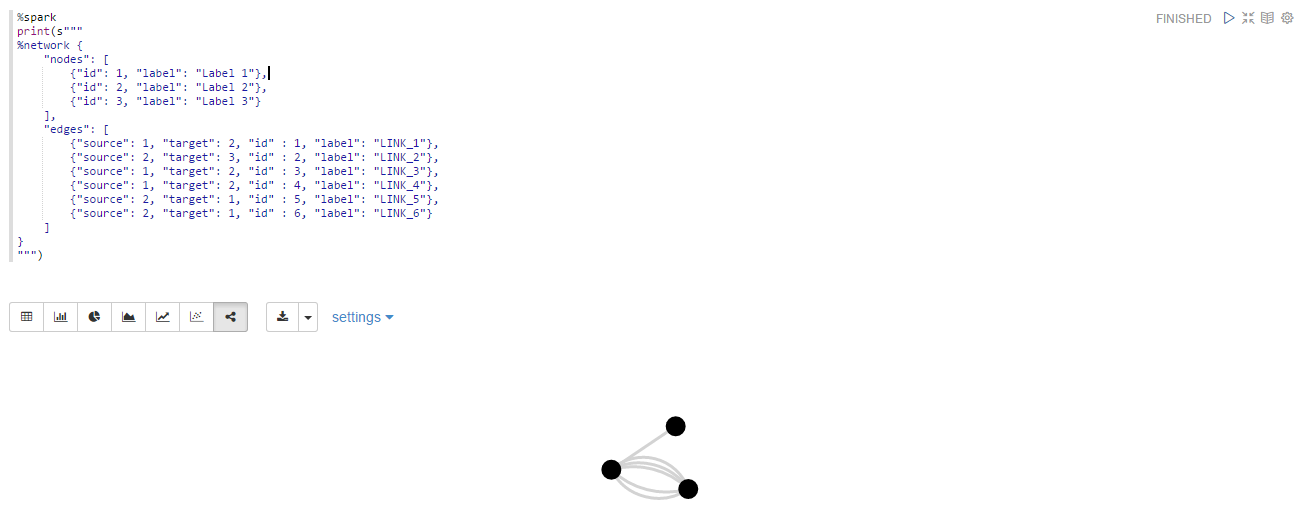
An example of a simple graph
%spark
print(s"""
%network {
    "nodes": [
        {"id": 1},
        {"id": 2},
        {"id": 3}
    ],
    "edges": [
        {"source": 1, "target": 2, "id" : 1},
        {"source": 2, "target": 3, "id" : 2},
        {"source": 1, "target": 2, "id" : 3},
        {"source": 1, "target": 2, "id" : 4},
        {"source": 2, "target": 1, "id" : 5},
        {"source": 2, "target": 1, "id" : 6}
    ]
}
""")
that will look like:
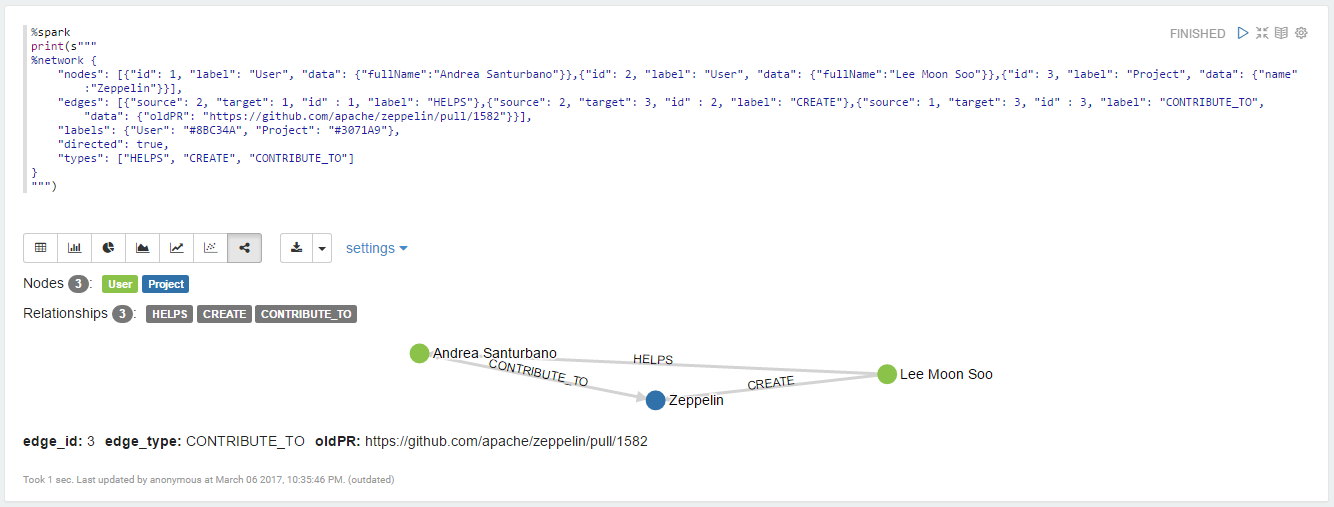
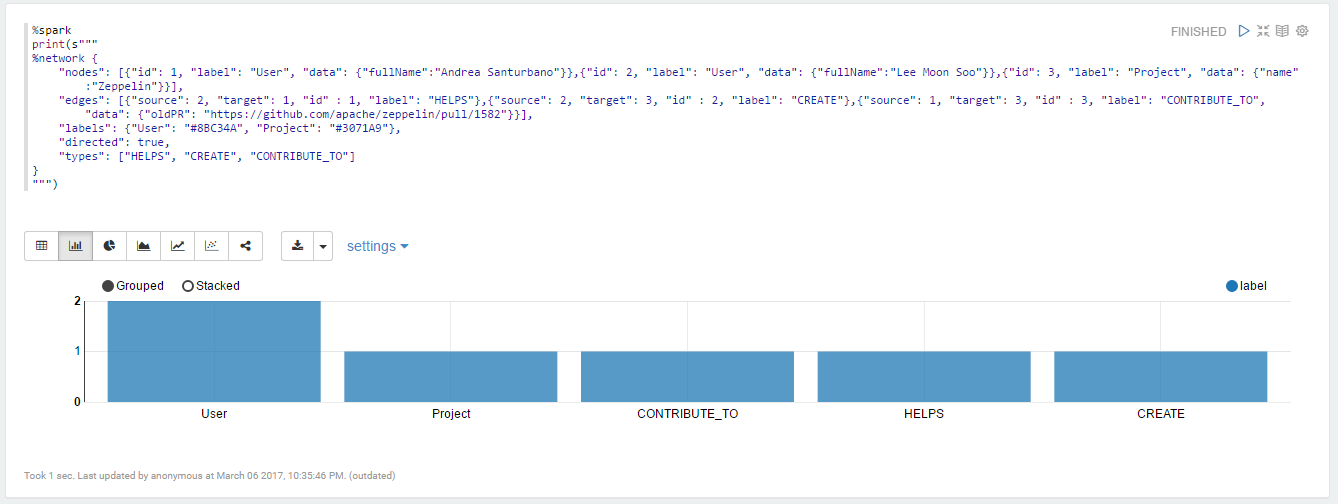
A little more complex graph:
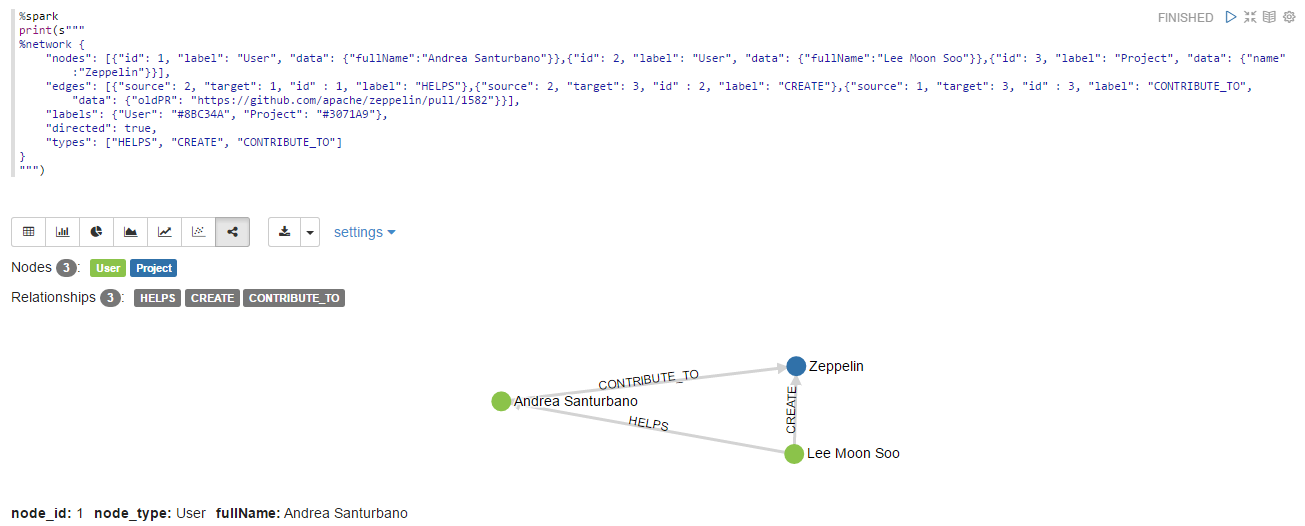
%spark
print(s"""
%network {
    "nodes": [{"id": 1, "label": "User", "data": {"fullName":"Andrea Santurbano"}},{"id": 2, "label": "User", "data": {"fullName":"Lee Moon Soo"}},{"id": 3, "label": "Project", "data": {"name":"Zeppelin"}}],
    "edges": [{"source": 2, "target": 1, "id" : 1, "label": "HELPS"},{"source": 2, "target": 3, "id" : 2, "label": "CREATE"},{"source": 1, "target": 3, "id" : 3, "label": "CONTRIBUTE_TO", "data": {"oldPR": "https://github.com/apache/zeppelin/pull/1582"}}],
    "labels": {"User": "#8BC34A", "Project": "#3071A9"},
    "directed": true,
    "types": ["HELPS", "CREATE", "CONTRIBUTE_TO"]
}
""")
that will look like: