R Interpreter for Apache Zeppelin
Overview
R is a free software environment for statistical computing and graphics.
To run R code and visualize plots in Apache Zeppelin, you will need R on your master node (or your dev laptop).
- For Centos:
yum install R R-devel libcurl-devel openssl-devel - For Ubuntu:
apt-get install r-base
Validate your installation with a simple R command:
R -e "print(1+1)"
To enjoy plots, install additional libraries with:
devtools with
R -e "install.packages('devtools', repos = 'http://cran.us.r-project.org')"knitr with
R -e "install.packages('knitr', repos = 'http://cran.us.r-project.org')"ggplot2 with
R -e "install.packages('ggplot2', repos = 'http://cran.us.r-project.org')"Other visualization libraries:
R -e "install.packages(c('devtools','mplot', 'googleVis'), repos = 'http://cran.us.r-project.org');
require(devtools); install_github('ramnathv/rCharts')"
We recommend you to also install the following optional R libraries for happy data analytics:
- glmnet
- pROC
- data.table
- caret
- sqldf
- wordcloud
Supported Interpreters
Zeppelin supports R language in 3 interpreters
| Name | Class | Description |
|---|---|---|
| %r.r | RInterpreter | Vanilla r interpreter, with least dependencies, only R environment installed is required.
It is always recommended to use the fully qualified interpreter name %r.rcode>, because %r is ambiguous,
it could mean both %spark.r and %r.r |
| %r.ir | IRInterpreter | Provide more fancy R runtime via [IRKernel](https://github.com/IRkernel/IRkernel), almost the same experience like using R in Jupyter. It requires more things, but is the recommended interpreter for using R in Zeppelin. |
| %r.shiny | ShinyInterpreter | Run Shiny app in Zeppelin |
If you want to use R with Spark, it is almost the same via %spark.r, %spark.ir & %spark.shiny . You can refer Spark Interpreter docs for more details.
Configuration
| Property | Default | Description |
|---|---|---|
| zeppelin.R.cmd | R | Path of the installed R binary. You should set this property explicitly if R is not in your $PATH(example: /usr/bin/R).
|
| zeppelin.R.knitr | true | Whether to use knitr or not. It is recommended to install [knitr](https://yihui.org/knitr/) |
| zeppelin.R.image.width | 100% | Image width of R plotting |
| zeppelin.R.shiny.iframe_width | 100% | IFrame width of Shiny App |
| zeppelin.R.shiny.iframe_height | 500px | IFrame height of Shiny App |
Using the R Interpreter(%r.r & %r.ir)
By default, the R Interpreter appears as two Zeppelin Interpreters, %r.r and %r.ir.
%r.r behaves like an ordinary REPL and use SparkR to communicate between R process and JVM process.
%r.ir use IRKernel underneath, it behaves like using IRKernel in Jupyter notebook.
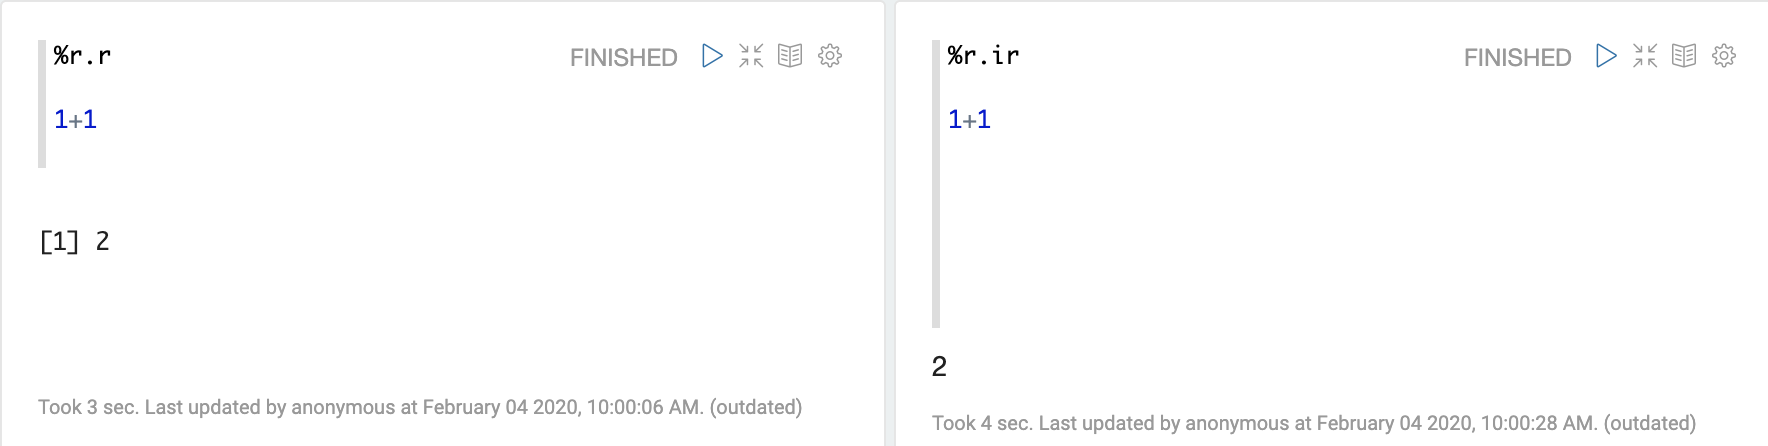
R basic expression
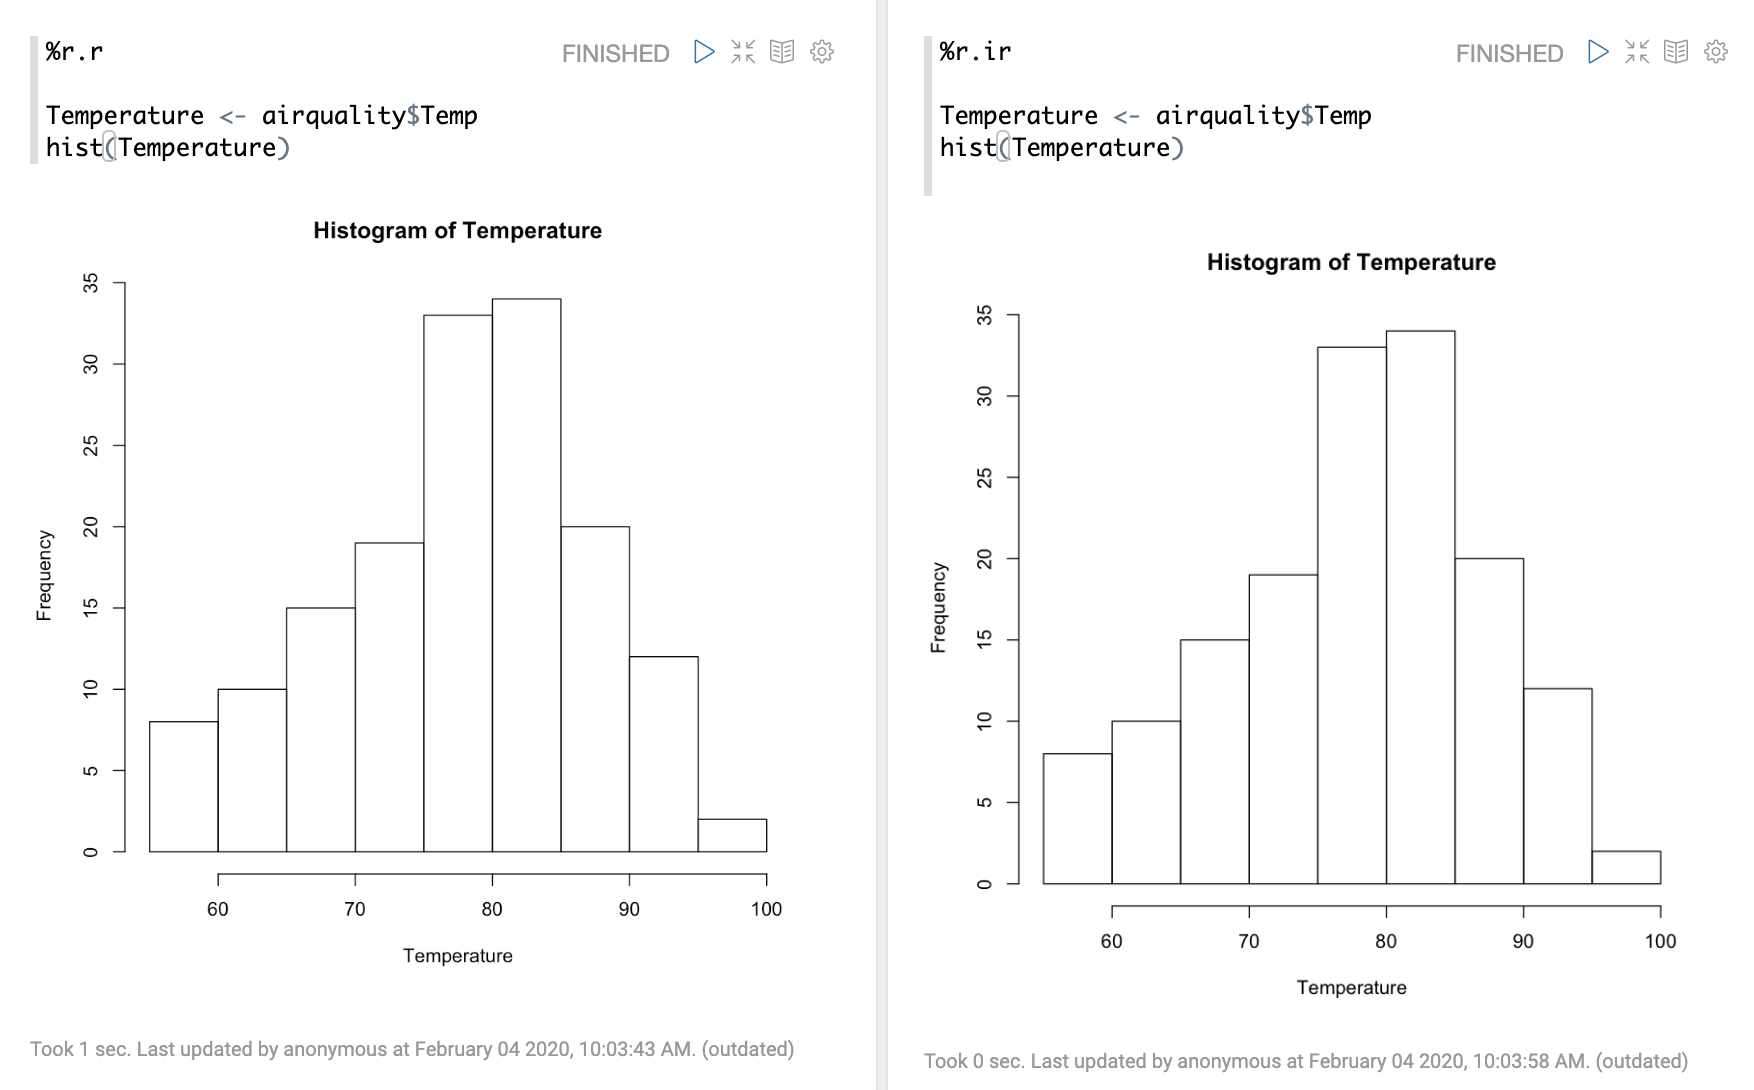
R base plotting is fully supported
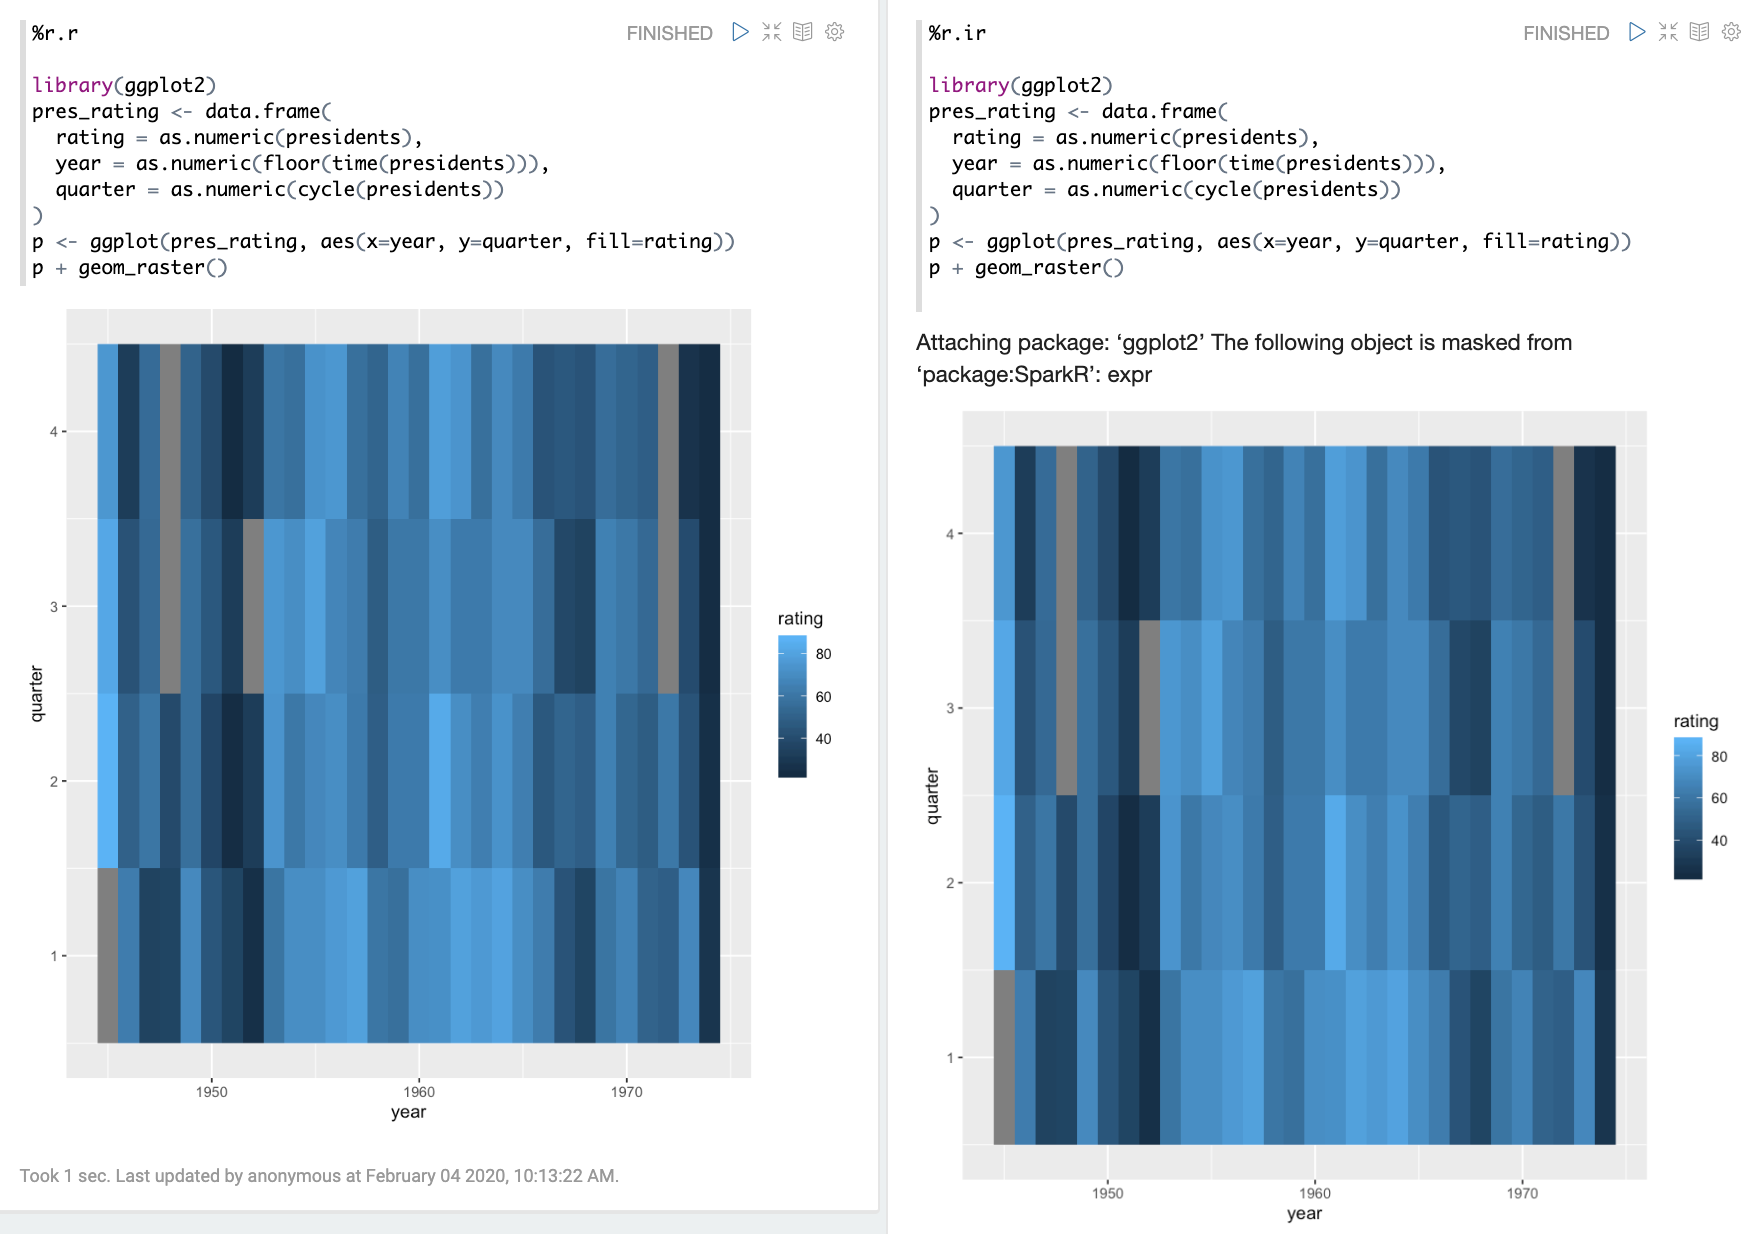
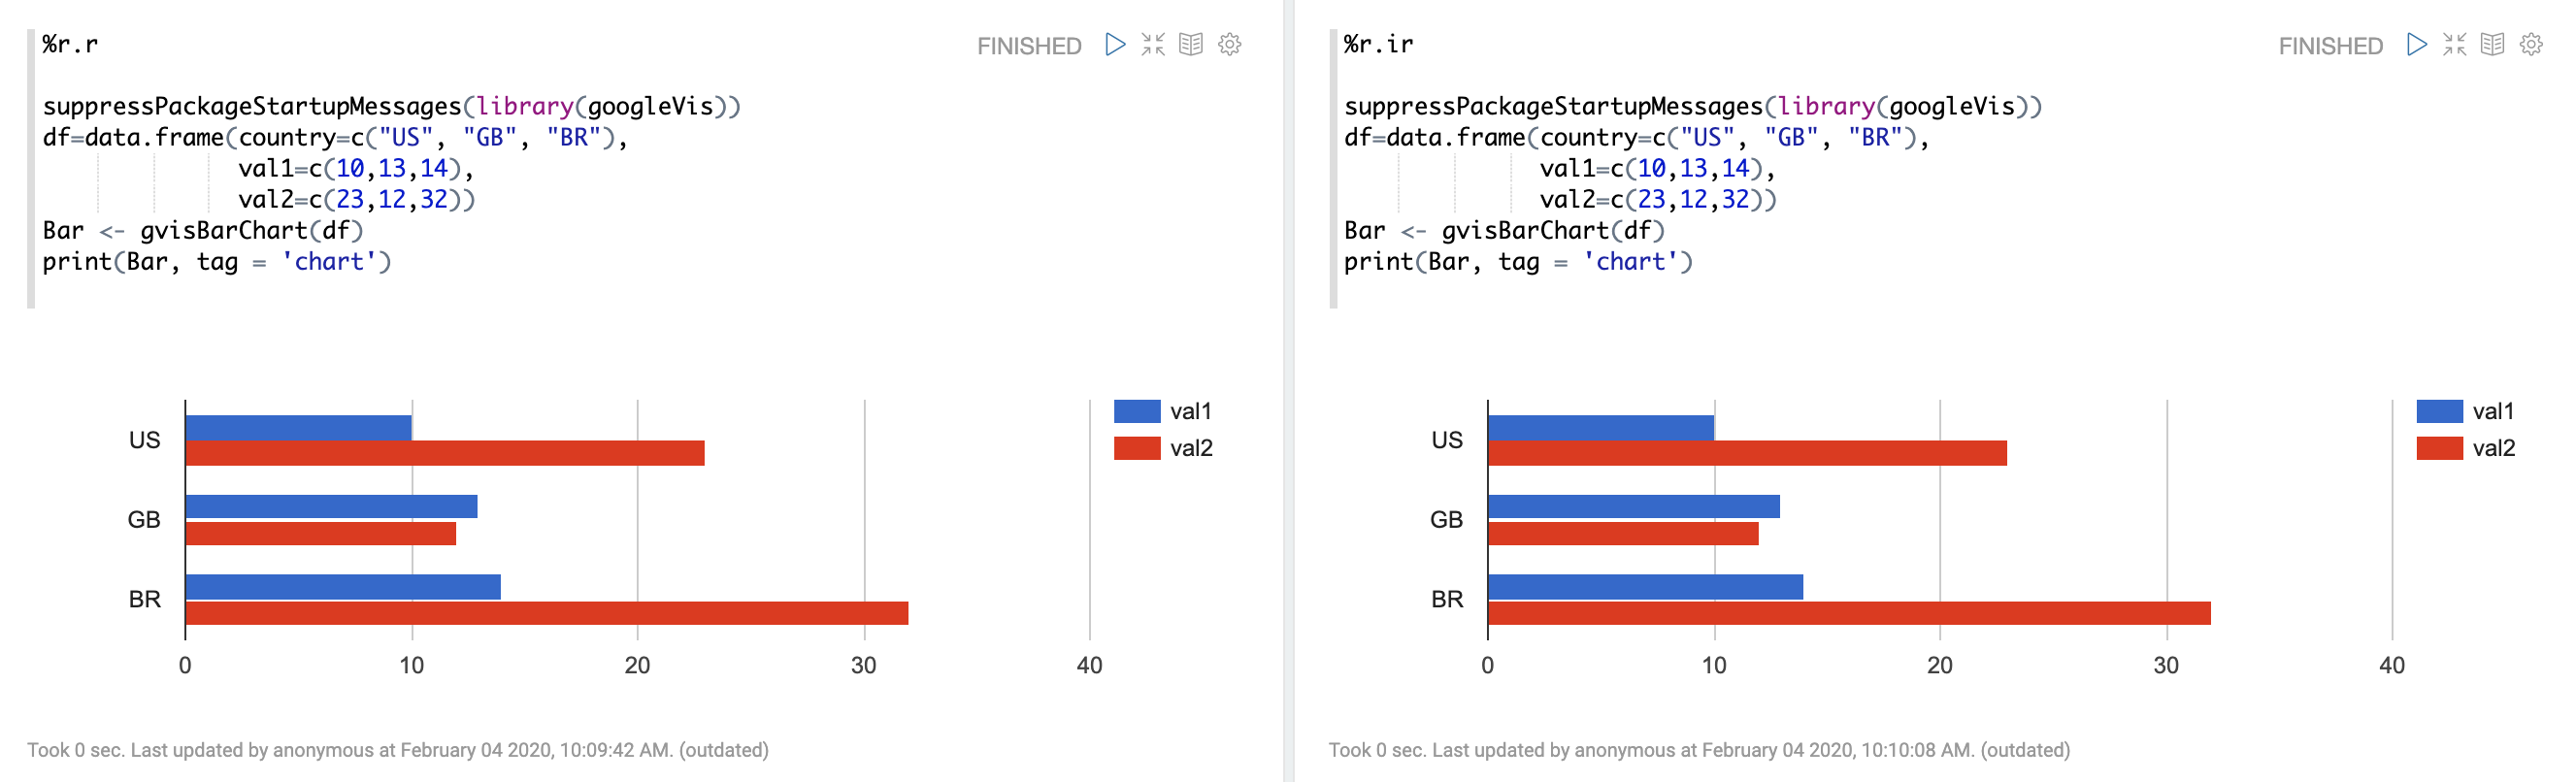
Besides R base plotting, you can use other visualization library, e.g. ggplot and googlevis
Make Shiny App in Zeppelin
Shiny is an R package that makes it easy to build interactive web applications (apps) straight from R. For developing one Shiny App in Zeppelin, you need to at least 3 paragraphs (server paragraph, ui paragraph and run type paragraph)
- Server type R shiny paragraph
%r.shiny(type=server)

# Define server logic to summarize and view selected dataset ----
server <- function(input, output) {

    # Return the requested dataset ----
    datasetInput <- reactive({
        switch(input$dataset,
        "rock" = rock,
        "pressure" = pressure,
        "cars" = cars)
    })

    # Generate a summary of the dataset ----
    output$summary <- renderPrint({
        dataset <- datasetInput()
        summary(dataset)
    })

    # Show the first "n" observations ----
    output$view <- renderTable({
        head(datasetInput(), n = input$obs)
    })
}
- UI type R shiny paragraph
%r.shiny(type=ui)

# Define UI for dataset viewer app ----
ui <- fluidPage(

    # App title ----
    titlePanel("Shiny Text"),

    # Sidebar layout with a input and output definitions ----
    sidebarLayout(

        # Sidebar panel for inputs ----
        sidebarPanel(

        # Input: Selector for choosing dataset ----
        selectInput(inputId = "dataset",
        label = "Choose a dataset:",
        choices = c("rock", "pressure", "cars")),

        # Input: Numeric entry for number of obs to view ----
        numericInput(inputId = "obs",
        label = "Number of observations to view:",
        value = 10)
        ),

        # Main panel for displaying outputs ----
        mainPanel(

        # Output: Verbatim text for data summary ----
        verbatimTextOutput("summary"),

        # Output: HTML table with requested number of observations ----
        tableOutput("view")

        )
    )
)
- Run type R shiny paragraph
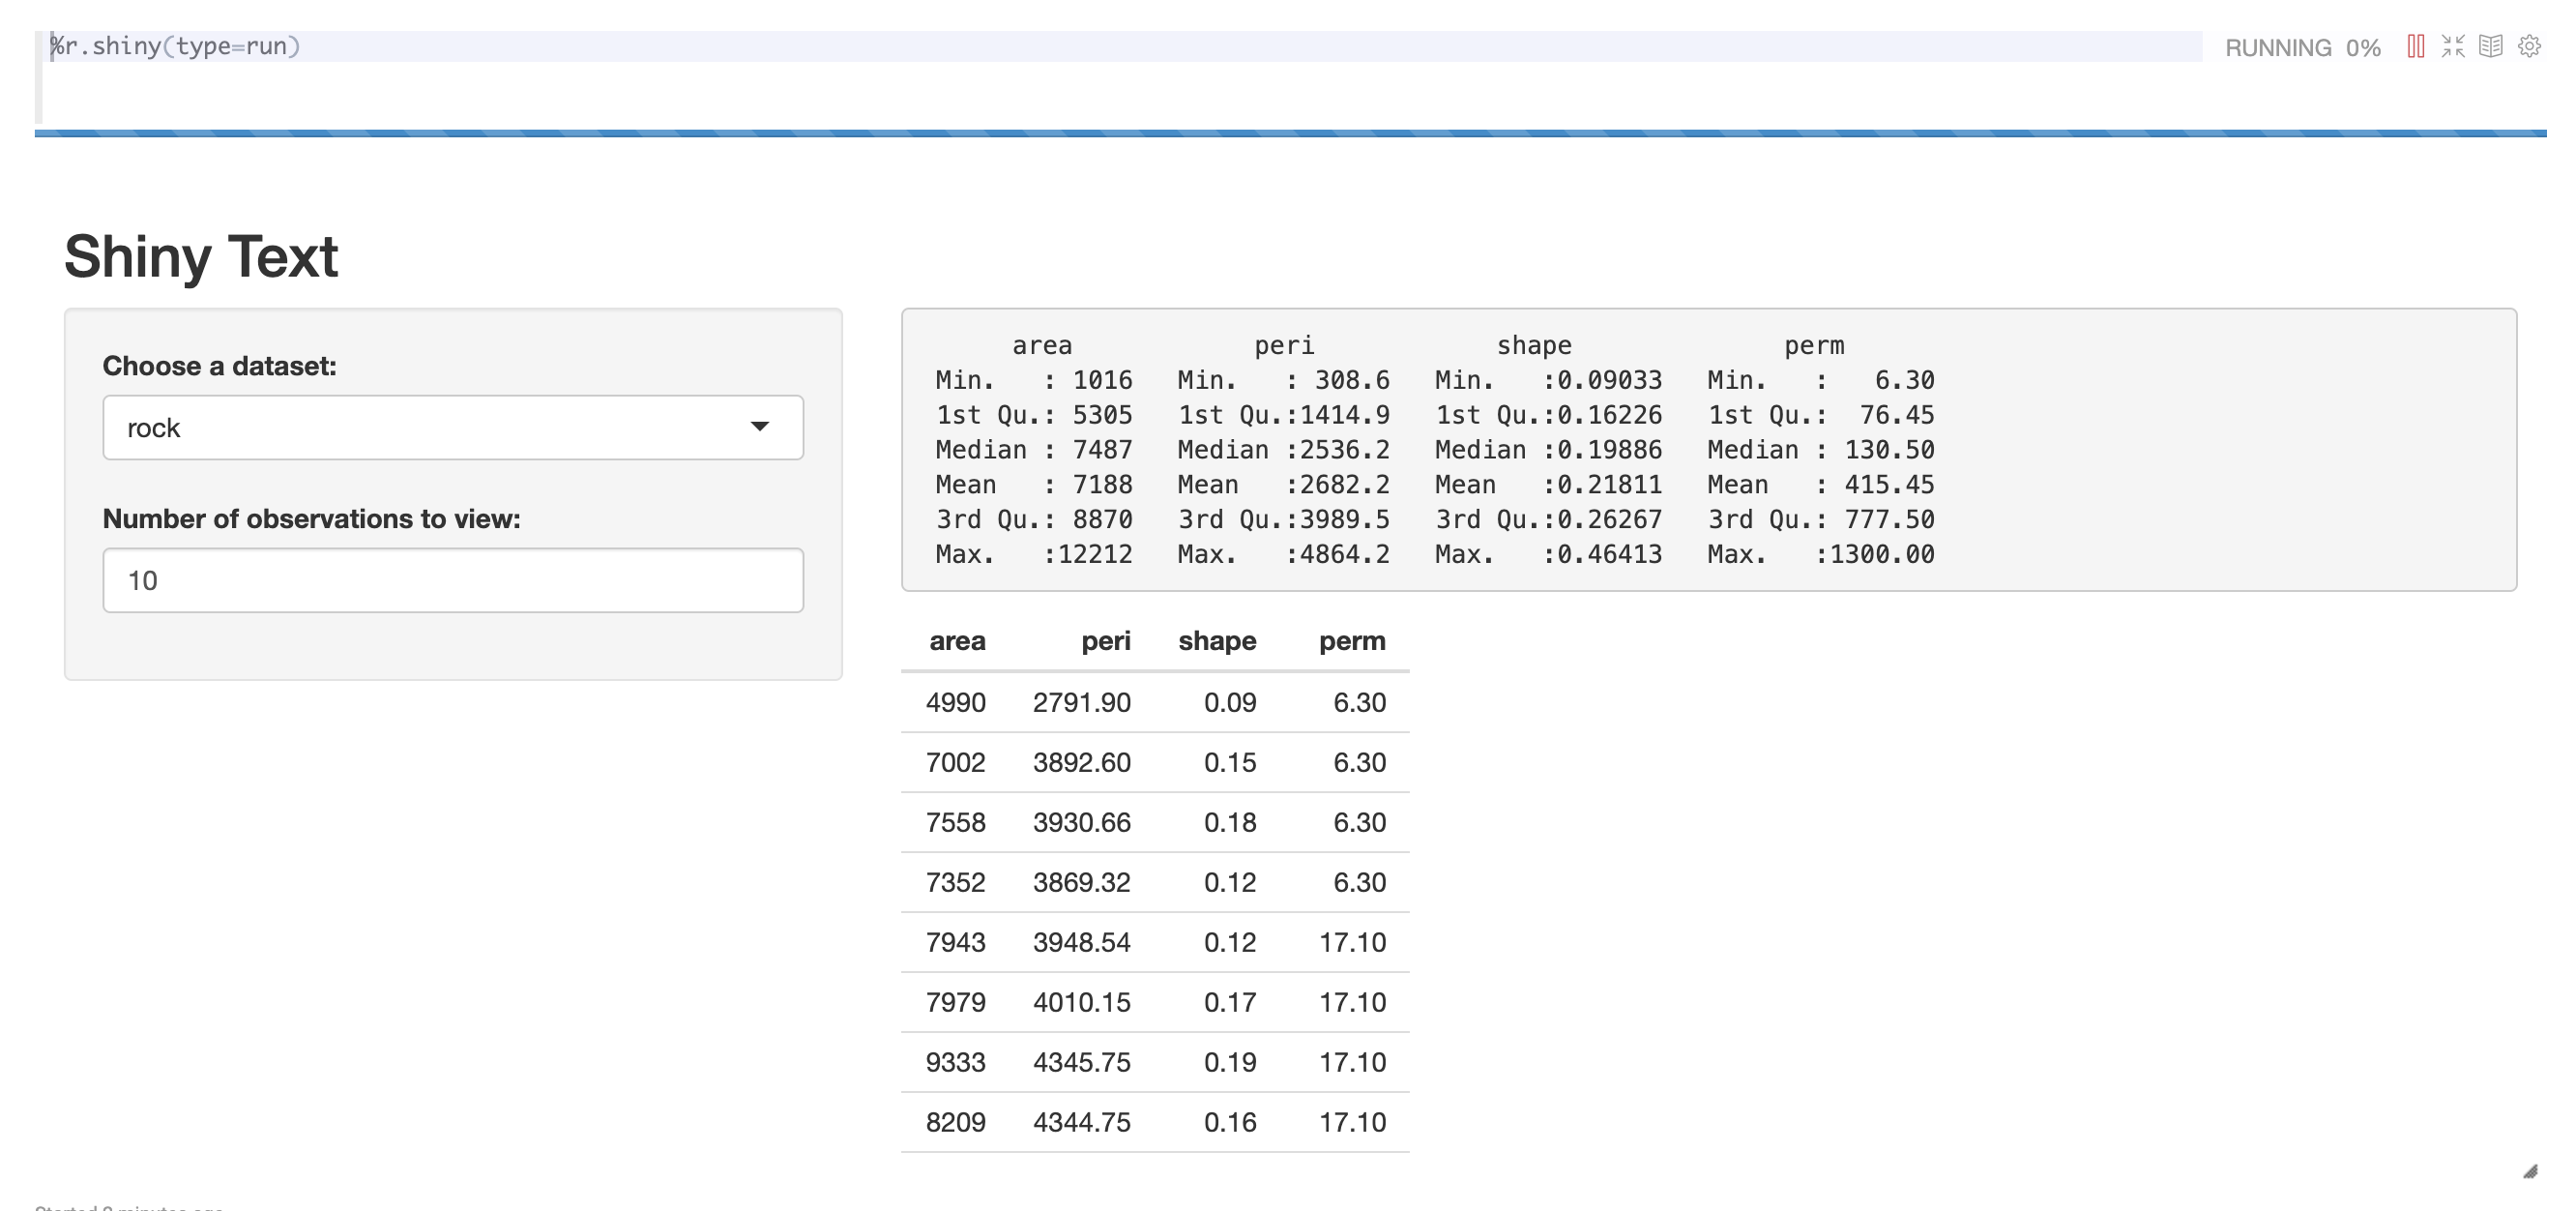
%r.shiny(type=run)
After executing the run type R shiny paragraph, the shiny app will be launched and embedded as Iframe in paragraph.
Run multiple shiny app
If you want to run multiple shiny app, you can specify app in paragraph local property to differentiate shiny app.
e.g.
%r.shiny(type=ui, app=app_1)
%r.shiny(type=server, app=app_1)
%r.shiny(type=run, app=app_1)